Performance Testing
Stress test
This stress test evaluates the performance and scalability of the MSR (Message State Replay) API under varying data loads. The testing focuses on the replay/state endpoint's ability to handle increasing volumes of unique entities while maintaining acceptable response times and resource utilization.
- Script to bump data: bump_cdc_events.sql
Test Methodology
- Data is incrementally loaded using a script that adds 11k unique entities per execution
- The msr-database service is stopped between API calls to prevent caching effects
- Each test scenario is executed 3 times for consistency
- Performance metrics include API response time, payload size, refresh job duration, and direct database query execution time
Summary results:
- SQL stmt to get replay/state is working fine (execute directly in database)
- refresh_snapshot is functioning well, within acceptable limits.
- API replay/state is having performance issue related to construction http response
Resource recommendations
Minimum Production Resources
resources:
  requests:
    cpu: "50m"
    memory: "128Mi"
  limits:
    cpu: "100m"
    memory: "1024Mi"
Recommended for 100k+ entities
resources:
  requests:
    cpu: "100m"
    memory: "256Mi"
  limits:
    cpu: "500m"
    memory: "2048Mi"
Test details
Local Environment (Dev container)
- macOS m4 device
- Podman (8 cores, 12GB RAM)
- Timescaledb version: 2.22.0
- Stop msr-database between each API call to avoid caching.
| Entities | API Response | Payload Size | DB Query | Refresh Job |
|---|---|---|---|---|
| 11k | < 1s | ~12MB | < 500ms | < 300ms |
| 22k | < 2s | ~24MB | < 1s | < 500ms |
| 60k | < 3.5s | ~65MB | 1s | ~1.5s |
| 100k | < 5s | ~108MB | < 3s | ~4s |
| 200k | < 9s | ~173MB | 5s | ~6s |
- On local machine: the replay/state API is working fine, the response time in acceptable
- Detailed results for test cases are below
- Also tested
SET LOCAL timescaledb.skip_scan_run_cost_multiplier = 0does not affect the performance in local machine
Dev Environment
Resources configuration:
resources:
  requests:
    cpu: "50m"
    memory: "128Mi"
  limits:
    cpu: "100m"
    memory: "1024Mi"
- Timescaledb version: 2.22.0
- Each scenario below run 3 times
| Entities | API Response | Payload Size | DB Query | Refresh Job |
|---|---|---|---|---|
| 11k | ~6s | ~12MB | < 500ms | ~300ms |
| 22k | ~10-11s | ~25MB | < 1s | ~500ms |
| 60k | 22-26s | ~68MB | 1s | ~1.5s |
| 100k | ~30s | ~90MB | < 3s | ~4s |
| 200k* | ~60s | ~173MB | 5s | ~6s |
*Requires 1GB memory limit
- Resource metrics:
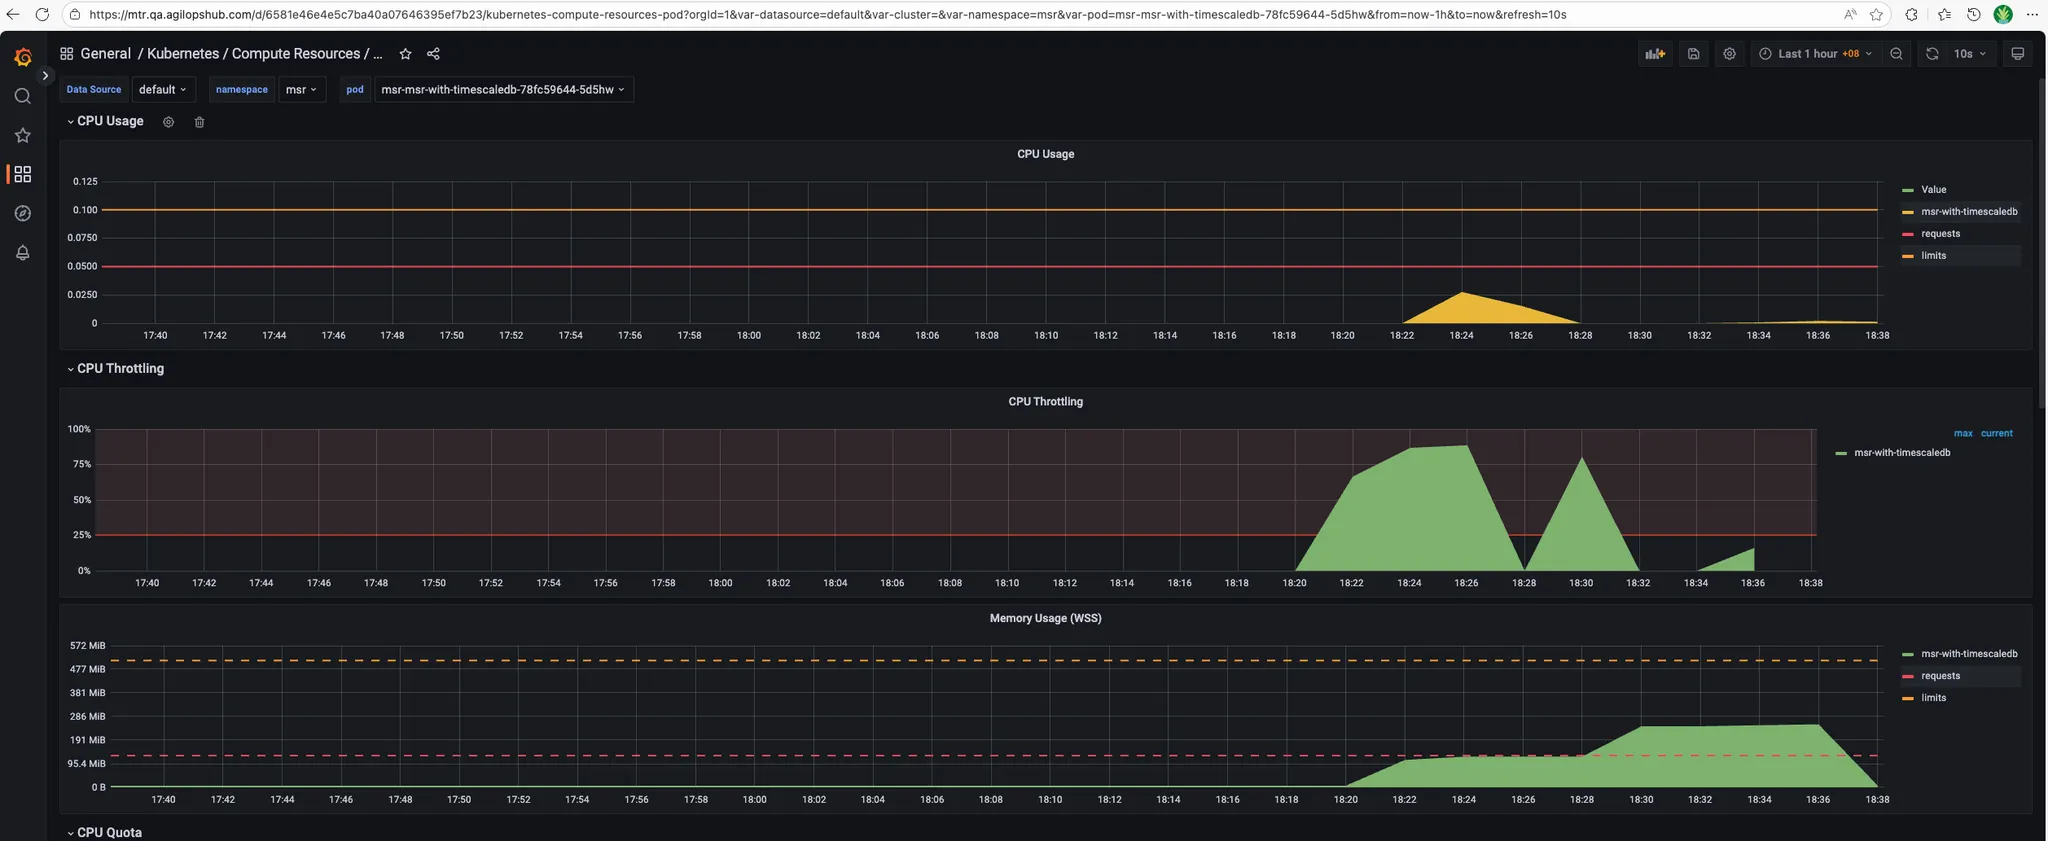
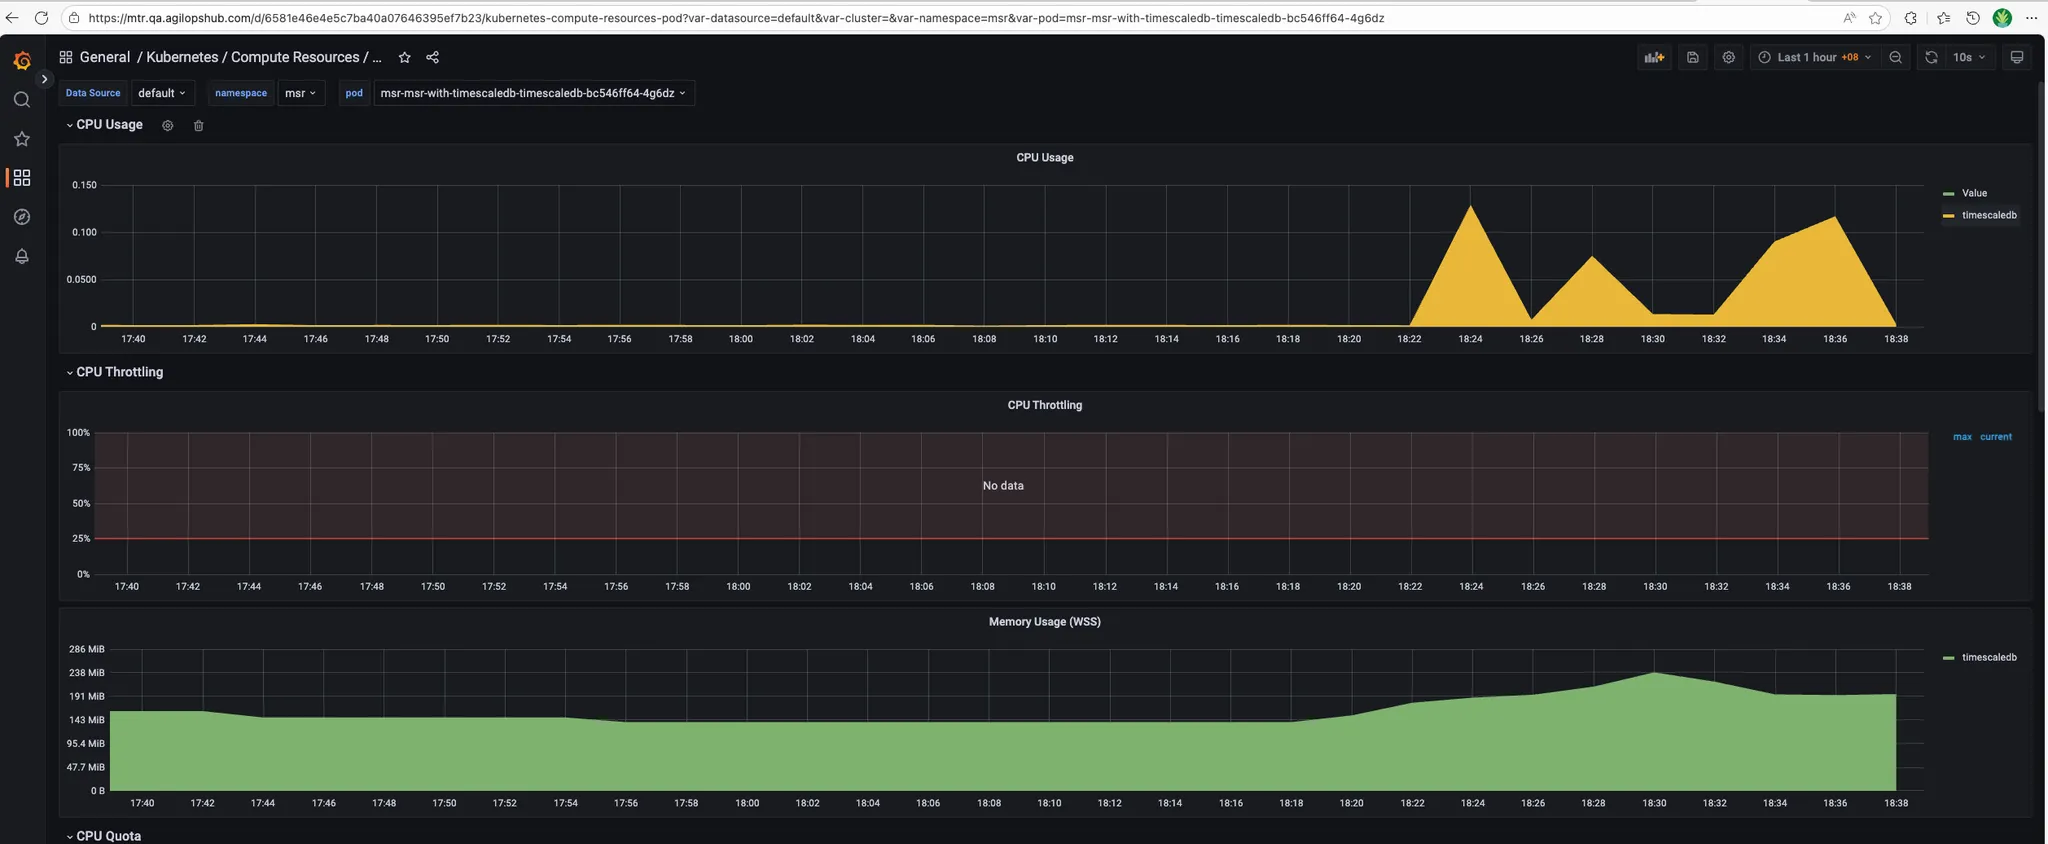
- MSR_APP:
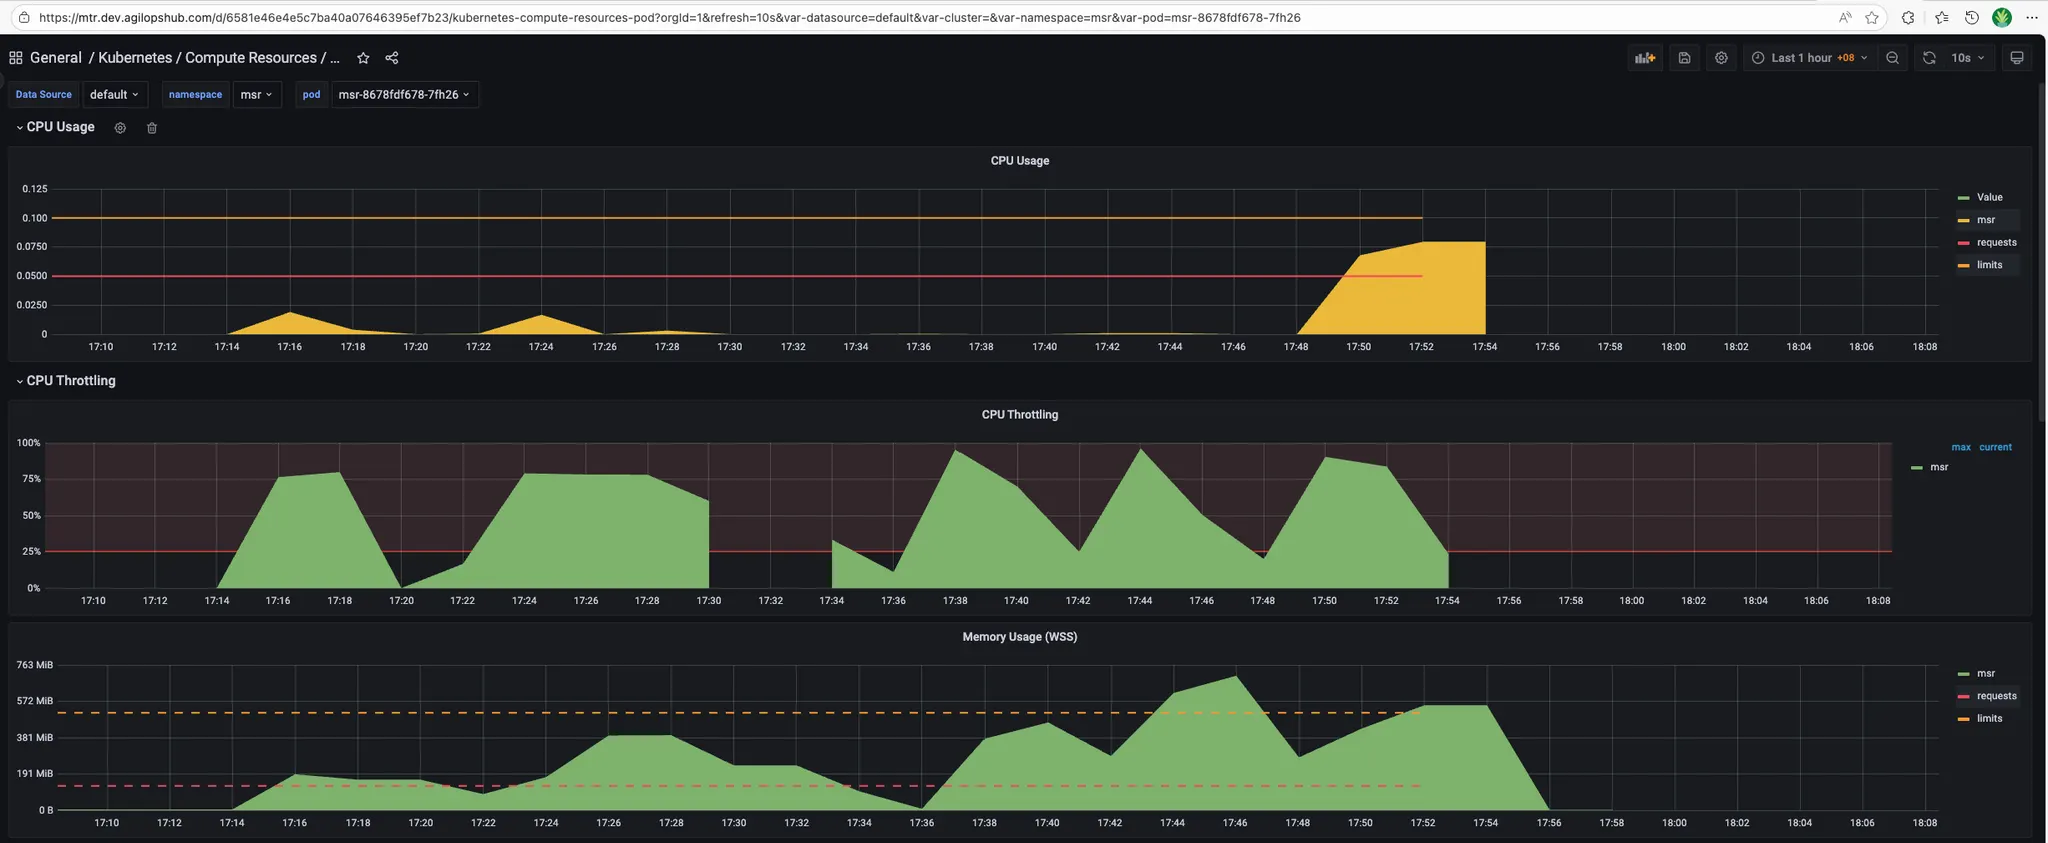
- Timescaledb:
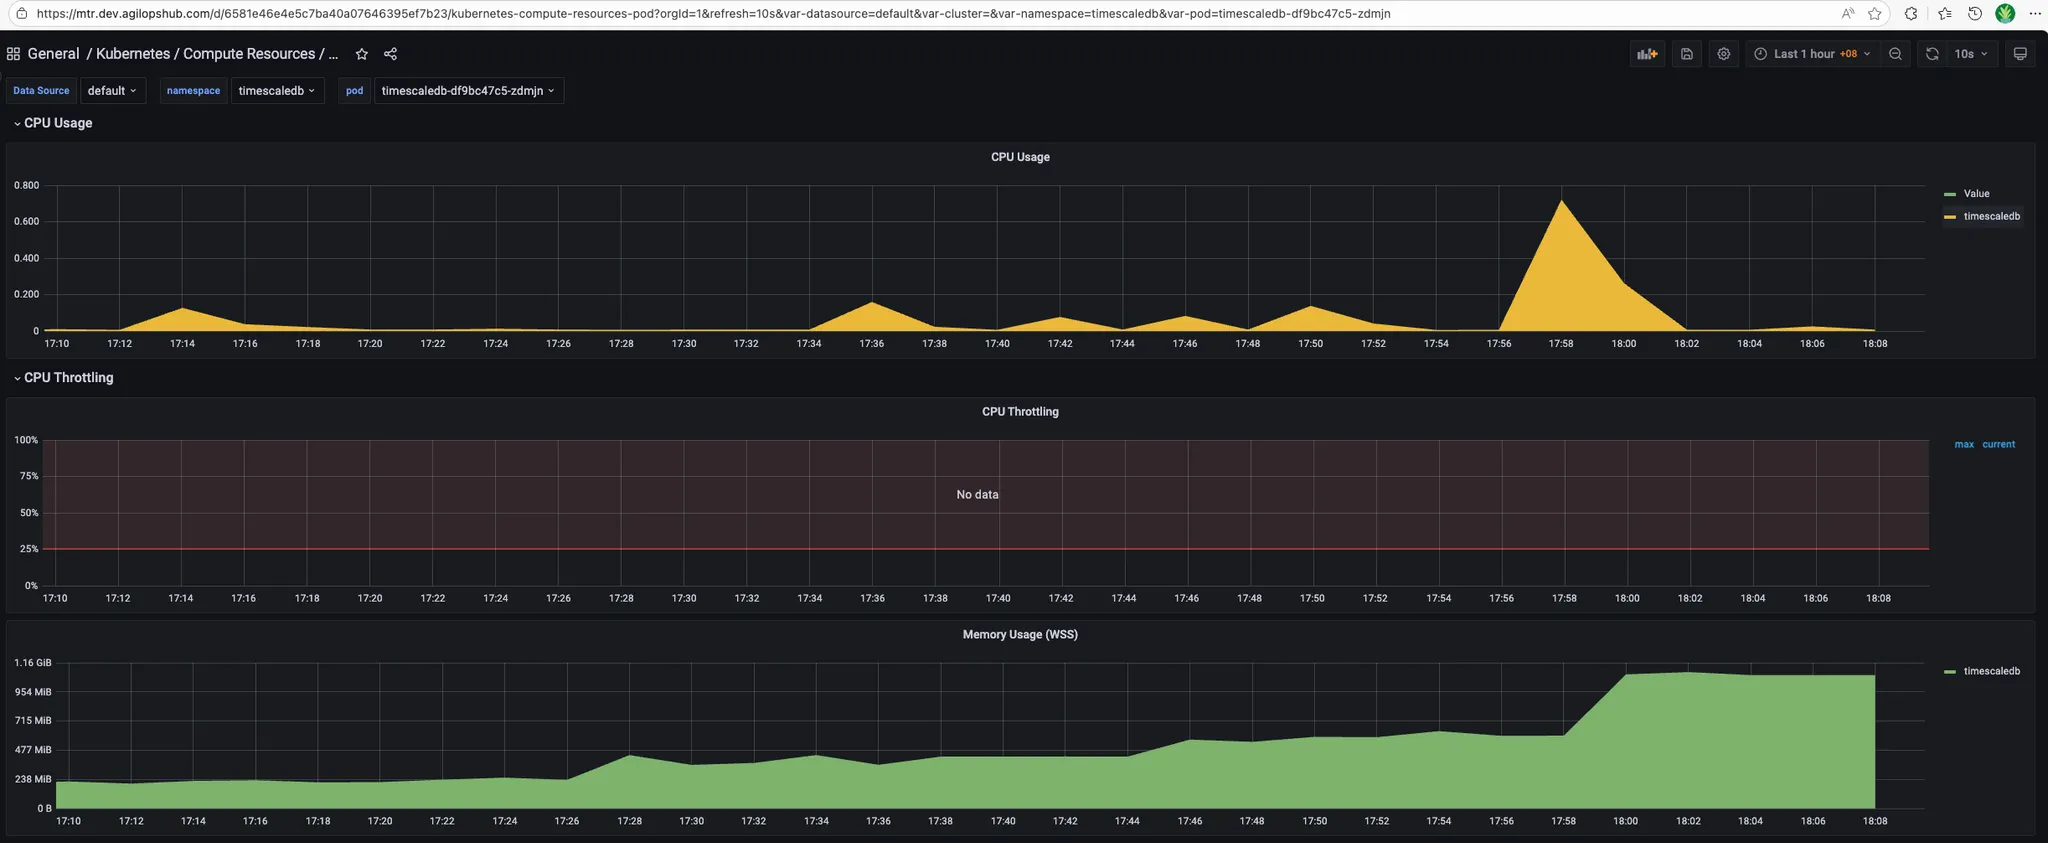
- MSR_APP:
QA Environment
Resources configuration:
resources:
  requests:
    cpu: "50m"
    memory: "128Mi"
  limits:
    cpu: "100m"
    memory: "512Mi"
- Timescaledb version: 2.22.0
- Each scenario below run 3 times
| Entities | API Response | Payload Size | DB Query | Refresh Job | Status |
|---|---|---|---|---|---|
| 11k | ~8s | ~12MB | ~1s | ~200ms | ✓ |
| 22k | ~18s | ~25MB | ~2s | ~300ms | ✓ |
| 60k | - | - | - | - | ✗ Crashed |
- Resource metrics:
- MSR_APP:
- Timescaledb:
Stress testing procedures
Prepare test data
# Edit bump_cdc_events.sql to generate larger batches: set p_total_days, p_runs_per_day, p_unique_entities_total (example: p_total_days := 1, p_runs_per_day := 1, p_unique_entities_total := 100000)
# Run the script
psql -h $DB_HOST -p $DB_PORT -U <username> -d <database> -f ./docs/bump_cdc_events.sql
Test Scenario 1: Baseline Performance (10k entities)
Objective: Establish baseline performance with minimal data
Steps:
-
Prepare test data:
-
Refresh snapshot (if using snapshot system):
SELECT msr.refresh_earliest_snapshot(); -
Stop and restart database if needed (to clear caches):
# Local environment
podman stop msr-database
podman start msr-database

# Kubernetes
kubectl delete pod -n <namespace> <msr-database-pod> -
Execute API test:
# Time the API call
time curl -w "\nHTTP Status: %{http_code}\nTotal Time: %{time_total}s\nSize: %{size_download} bytes\n" \
  -H "Authorization: Bearer $TOKEN" \
"$API_URL/replay/state?timestamp=$(date -u +%Y-%m-%dT%H:%M:%SZ)" -
Execute direct database query (for comparison):
\timing on
SELECT * FROM msr.entity_last_states
WHERE snapshot_time <= NOW(); -
Record results:
- API response time: _______
- API payload size: _______
- Database query time: _______
- Refresh job duration: _______
- Memory usage (peak): _______
- CPU usage (peak): _______
-
Repeat 3 times for consistency
Test Scenario 2: Medium Load (22k-60k entities)
Objective: Test performance under moderate data volumes
Steps:
-
Add more test data
-
Verify entity count:
SELECT COUNT(DISTINCT entity_id) FROM msr.cdc_event; -
Repeat Test Scenario 1 steps 2-7
-
Continue adding data in 11k increments until reaching 60k entities
-
Record results at each increment (22k, 33k, 44k, 55k, 60k)
Test Scenario 3: High Load (100k entities)
Objective: Test performance at expected production scale
Steps:
-
Add test data to reach 100k entities
-
Monitor resource usage during data generation:
# In separate terminal, monitor continuously
watch -n 2 'kubectl top pods -n <namespace> | grep msr' -
Repeat Test Scenario 1 steps 2-7
-
Check for error conditions:
- Out of memory errors
- Connection timeouts
- Database connection pool exhaustion
Test Scenario 4: Stress Test (200k+ entities)
Objective: Identify breaking points and resource limits
Warning: This test may cause service degradation or failure. Only run in non-production environments.
Steps:
-
Increase resource limits (if possible):
resources:
  limits:
    memory: "2048Mi"
cpu: "500m" -
Generate large dataset:
-- Edit bump_cdc_events.sql
-- Set p_unique_entities_total := 200000
\i docs/bump_cdc_events.sql -
Repeat Test Scenario 1 steps 2-7
-
Monitor for failures:
# Watch logs in real-time
kubectl logs -f -n <namespace> <msr-app-pod>

# Watch for pod restarts
kubectl get events -n <namespace> --watch -
Document failure modes:
- At what entity count did failures occur?
- What was the failure type? (OOM, timeout, crash)
- What were resource metrics at failure?
Test Scenario 5: Concurrent User Load
Objective: Test multi-session performance
Example: Create concurrent API requests:
# Simple concurrent test with curl
for i in {1..5}; do
  curl -H "Authorization: Bearer $TOKEN" \
    "$API_URL/replay/state?timestamp=<timestamp_in_RFC3339_format>" \
    > /tmp/response_$i.json &
done
wait
Cleanup Test Data
After testing, clean up test data:
-- Delete test data (be careful!)
DELETE FROM msr.cdc_event
WHERE entity_id LIKE '%test%'
  OR event_timestamp > '<test-start-time>';

-- Vacuum to reclaim space
VACUUM FULL msr.cdc_event;

-- Reset snapshot
SELECT msr.refresh_earliest_snapshot();
Troubleshooting stress tests
Issue: API Response Much Slower Than Direct DB Query
Symptoms: Database query returns in < 10s, but API takes > 30s
Diagnosis:
-- Enable query logging
SET log_min_duration_statement = 0;

-- Check for serialization overhead
EXPLAIN ANALYZE SELECT * FROM msr.entity_last_states;
Solutions:
- Investigate JSON serialization performance
- Check for memory allocation issues in application code
- Review HTTP response construction logic
- See Performance Troubleshooting Guide for details
Issue: Out of Memory Errors
Symptoms: Application crashes or pod restarts during large requests
Diagnosis:
# Check OOM kills
kubectl describe pod <msr-app-pod> | grep -i oom

# Check memory usage trends
kubectl top pod <msr-app-pod>
Solutions:
- Increase memory limits
- Implement response streaming
- Add pagination to API endpoints
- Optimize data structures in application code
Issue: Database Connection Pool Exhaustion
Symptoms: "Too many connections" errors during concurrent tests
Diagnosis:
-- Check active connections
SELECT count(*) FROM pg_stat_activity
WHERE datname = current_database();

-- Check connection limits
SHOW max_connections;
Solutions:
- Tune connection pool settings
- Implement connection retry logic
- Add connection monitoring/alerts
- Scale database horizontally if needed
Infrastructure Metrics
1. API Response Time
Metric: msr_api_response_duration_seconds
What it measures: Time taken to process and respond to API requests
Target:
- P50: < 5s (60k entities)
- P95: < 10s (60k entities)
- P99: < 15s (60k entities)
Alert Thresholds:
- Warning: P95 > 15s for 5 minutes
- Critical: P95 > 30s for 5 minutes
- Critical: P50 > 20s for 5 minutes
2. Pod Memory Usage
Metric: Container memory consumption
What it measures: Memory used by MSR pods
Target: < 80% of memory limit
Collection Method:
kubectl top pod <msr-app-pod>
3. Pod CPU Usage
Metric: Container CPU consumption
What it measures: CPU used by MSR pods
Target: < 80% of CPU limit
Collection Method:
kubectl top pod <msr-app-pod>
4. Pod Restart Count
Metric: Number of pod restarts
What it measures: Pod stability
Target: Zero unexpected restarts
Collection Method:
kubectl get pods -o json | jq '.items[].status.containerStatuses[].restartCount'
5. Disk I/O Wait
Metric: I/O wait percentage
What it measures: Time spent waiting for disk I/O
Target: < 20%
Performance Checklist
When investigating performance issues, work through this checklist:
Initial Assessment
- Identify affected environment (local, dev, qa, prod)
- Determine entity count / data volume
- Measure baseline performance
- Check recent changes or deployments
- Review resource limits and usage
Database Layer
- Check query execution time (EXPLAIN ANALYZE)
- Verify indexes exist and are being used
- Check table statistics are up-to-date
- Monitor active queries and connections
- Check for table bloat
- Verify TimescaleDB policies are running
Application Layer
- Compare API time vs DB query time
- Check application logs for errors
- Monitor memory usage trends
- Check connection pool health
- Profile CPU and memory (pprof)
- Check for goroutine leaks
Infrastructure
- Verify CPU and memory limits are adequate
- Check for resource contention
- Monitor disk I/O
- Check for OOMKilled events
- Review pod scheduling and node health
Load test
Overview
This document summarizes the load testing results for the MSR replay/state API endpoint.
Test Configurations
The following test scenarios were executed to evaluate system performance under different load conditions:
| Test Scenario | Threads (Users) | Loops | Total Requests |
|---|---|---|---|
| 1_thread_1_loop | 1 | 1 | 1 |
| 5_thread_1_loop | 5 | 1 | 5 |
| 5_thread_5_loop | 5 | 5 | 25 |
| 5_thread_10_loop | 5 | 10 | 50 |
| 25_thread_1_loop | 25 | 1 | 25 |
| 50_thread_1_loop | 50 | 1 | 50 |
Key Performance Metrics
- Data source:
- Total records: 3.6M
- Total unique entities: 100k
- Data durations: 30 days
1. Single Thread Baseline (1 thread x 1 loop)
Summary:
- Total Requests: 1
- Success Rate: 100%
- Response Time: 2,005 ms
- Latency: 878 ms
- Connection Time: 154 ms
- Response Size: ~5.86 MB
Analysis: Baseline performance with a single request shows acceptable response time of approximately 2 seconds for the large response payload.
2. Low Concurrency Test (5 threads x 1 loop)
Summary:
- Total Requests: 5
- Success Rate: 100%
- Average Response Time: ~5,790 ms
- Response Time Range: 3,741 ms - 7,291 ms
- Average Latency: ~2,761 ms
- Connection Time Range: 152 ms - 196 ms
Analysis: With 5 concurrent users, response times increased significantly to approximately 3-7 seconds. The system handled the load without errors, but showed performance degradation compared to the baseline.
3. Medium Sustained Load (5 threads x 5 loops)
Summary:
- Total Requests: 25
- Success Rate: 100%
- Response Time Range: 2,490 ms - 12,171 ms
- Average Response Time: ~4,500 ms
- Connection Time Range: 144 ms - 1,156 ms
Key Observations:
- First iteration showed higher response times (3,896 ms - 7,355 ms)
- Subsequent iterations improved with response times ranging from 2,238 ms - 5,861 ms
- Some requests showed prolonged connection times over 1 second
- System maintained stability across all iterations
Analysis: The system demonstrated good resilience under sustained load with 5 concurrent threads. Performance improved after initial requests, suggesting effective caching or connection pooling mechanisms.
4. Extended Medium Load (5 threads x 10 loops)
Summary:
- Total Requests: 50
- Success Rate: 100%
- Response Time Range: 2,125 ms - 29,154 ms
- Majority of Requests: 2,000 ms - 6,000 ms
- Peak Response Time: 29,154 ms (outlier)
Key Observations:
- Most requests completed within 2-6 seconds
- Several outlier requests exceeded 10+ seconds
- Connection establishment remained stable (138 ms - 704 ms)
- No request failures despite extended duration
Analysis: Under prolonged load, the system remained stable but showed occasional performance spikes. The outliers suggest potential resource contention or garbage collection events.
5. High Concurrency Test (25 threads x 1 loop)
Summary:
- Total Requests: 25
- Success Rate: 100%
- Response Time Range: 8,036 ms - 30,820 ms
- Average Response Time: ~20,000 ms
- Latency Range: 6,860 ms - 21,108 ms
- Connection Time Range: 140 ms - 196 ms
Performance Distribution:
- 8-15 seconds: 8 requests (32%)
- 15-25 seconds: 12 requests (48%)
- 25-31 seconds: 5 requests (20%)
Key Observations:
- All 25 concurrent requests completed successfully with no failures
- Median response time: ~22 seconds
- Fastest request: 8.0 seconds, slowest: 30.8 seconds
- Connection establishment remained very stable (140-196 ms)
Analysis: At 25 concurrent users, the system maintained 100% reliability while response times increased to 8-31 seconds range. While significantly slower than lower concurrency tests, the system handled the load without any failures, demonstrating good stability under high concurrent load.
6. High Concurrency Test (50 threads x 1 loop)
Summary:
- Total Requests: 50
- Success Rate: 76% (38/50 successful)
- Failed Requests: 12 (500 Internal Server Error)
- Response Time Range (Successful): 9,006 ms - 56,562 ms
- Average Response Time (Successful): ~42,000 ms
- Failed Request Times: 33,533 ms - 38,203 ms
- Latency Range: 7,909 ms - 44,521 ms
- Connection Time Range: 139 ms - 229 ms
Performance Distribution (Successful Requests):
- 9-20 seconds: 6 requests (16%)
- 20-30 seconds: 3 requests (8%)
- 30-40 seconds: 9 requests (24%)
- 40-50 seconds: 12 requests (31%)
- 50-57 seconds: 8 requests (21%)
Failed Requests:
- Thread 1-8: 37,043 ms - Internal Server Error
- Thread 1-11: 38,203 ms - Internal Server Error
- Thread 1-20: 34,091 ms - Internal Server Error
- Thread 1-22: 37,543 ms - Internal Server Error
- Thread 1-25: 37,454 ms - Internal Server Error
- Thread 1-26: 37,512 ms - Internal Server Error
- Thread 1-27: 37,873 ms - Internal Server Error
- Thread 1-32: 37,717 ms - Internal Server Error
- Thread 1-34: 37,287 ms - Internal Server Error
- Thread 1-39: 37,188 ms - Internal Server Error
- Thread 1-46: 36,267 ms - Internal Server Error
- Thread 1-48: 33,533 ms - Internal Server Error
Key Observations:
- 24% failure rate (12 out of 50 requests failed)
- Failures occurred between 33-38 seconds, suggesting a timeout threshold
- Most failures happened around the 37-second mark (10 out of 12 failures)
- Successful requests took significantly longer (up to 57 seconds)
- Connection establishment remained stable (139-229 ms)
Analysis: At maximum tested load of 50 concurrent threads, the system reached its breaking point with a 24% failure rate. All failures were 500 Internal Server Errors occurring between 33-38 seconds, strongly suggesting a server-side timeout or resource exhaustion threshold. This represents a critical degradation compared to the 25-thread test which maintained 100% success. The 50-thread mark clearly exceeds the system's current capacity limits.
Performance Trends
Response Time vs. Concurrency
| Threads | Avg Response Time | Success Rate | Performance Ratio |
|---|---|---|---|
| 1 | 2.0s | 100% | 1x (baseline) |
| 5 | 5.8s | 100% | 2.9x slower |
| 25 | 20.0s | 100% | 10x slower |
| 50 | 42.0s | 76% | 21x slower |
Key Findings
-
Non-Linear Performance Degradation: Response times increased exponentially as concurrent users increased. At 5 threads, performance degraded by 3x; at 25 threads, by 10x; and at 50 threads, by 21x compared to baseline. This indicates severe bottlenecks under high concurrency.
-
Capacity Threshold Identified: The system maintained 100% success rate up to 25 concurrent threads but experienced a 24% failure rate at 50 threads, identifying a critical capacity threshold between 25-50 concurrent users.
-
Timeout Pattern at 35-38 Seconds: All 12 failures at 50 threads occurred between 33-38 seconds (most at ~37 seconds), strongly indicating a server-side timeout configuration or resource exhaustion threshold around 35-40 seconds.
-
Response Size Impact: The large response payload (~5.86 MB per request) significantly impacts performance under load. At 50 threads, the system attempts to process ~293 MB of response data simultaneously, contributing to bandwidth saturation, memory pressure, and extended response times.
-
Connection Layer Stability: Connection establishment times remained consistently stable across all test scenarios (139 ms - 229 ms), indicating the bottleneck is not at the network connection layer but rather in application processing, database queries, or bandwidth constraints.
-
System Breaking Point: The system's breaking point is between 25-50 concurrent threads. At 25 threads, the system is stressed but functional (100% success). At 50 threads, the system is overwhelmed (76% success), making this the maximum capacity limit without optimization.
Recommendations
Performance Improvements
-
Connection Pooling: Ensure proper database and HTTP connection pooling to handle concurrent requests efficiently.
-
Resource Scaling: Current performance suggests the system may need vertical or horizontal scaling to support more than 5-10 concurrent users effectively.
-
Timeout Configuration: Review and adjust timeout settings, particularly for requests approaching or exceeding 30 seconds.
-
Load Balancing: Consider implementing load balancing if not already in place to distribute traffic across multiple instances.
Monitoring
-
Set SLA Targets: Based on these results, establish clear Service Level Agreements (e.g., 95% of requests complete within 5 seconds for up to 5 concurrent users).
-
Alerting: Implement monitoring and alerting for:
- Response times exceeding 10 seconds
- Error rates above 5%
- Server resource utilization (CPU, memory, network)
-
Continuous Testing: Establish regular load testing schedule to track performance trends over time.
Resource metrics during load test
-
MSR_APP:
- CPU usage:
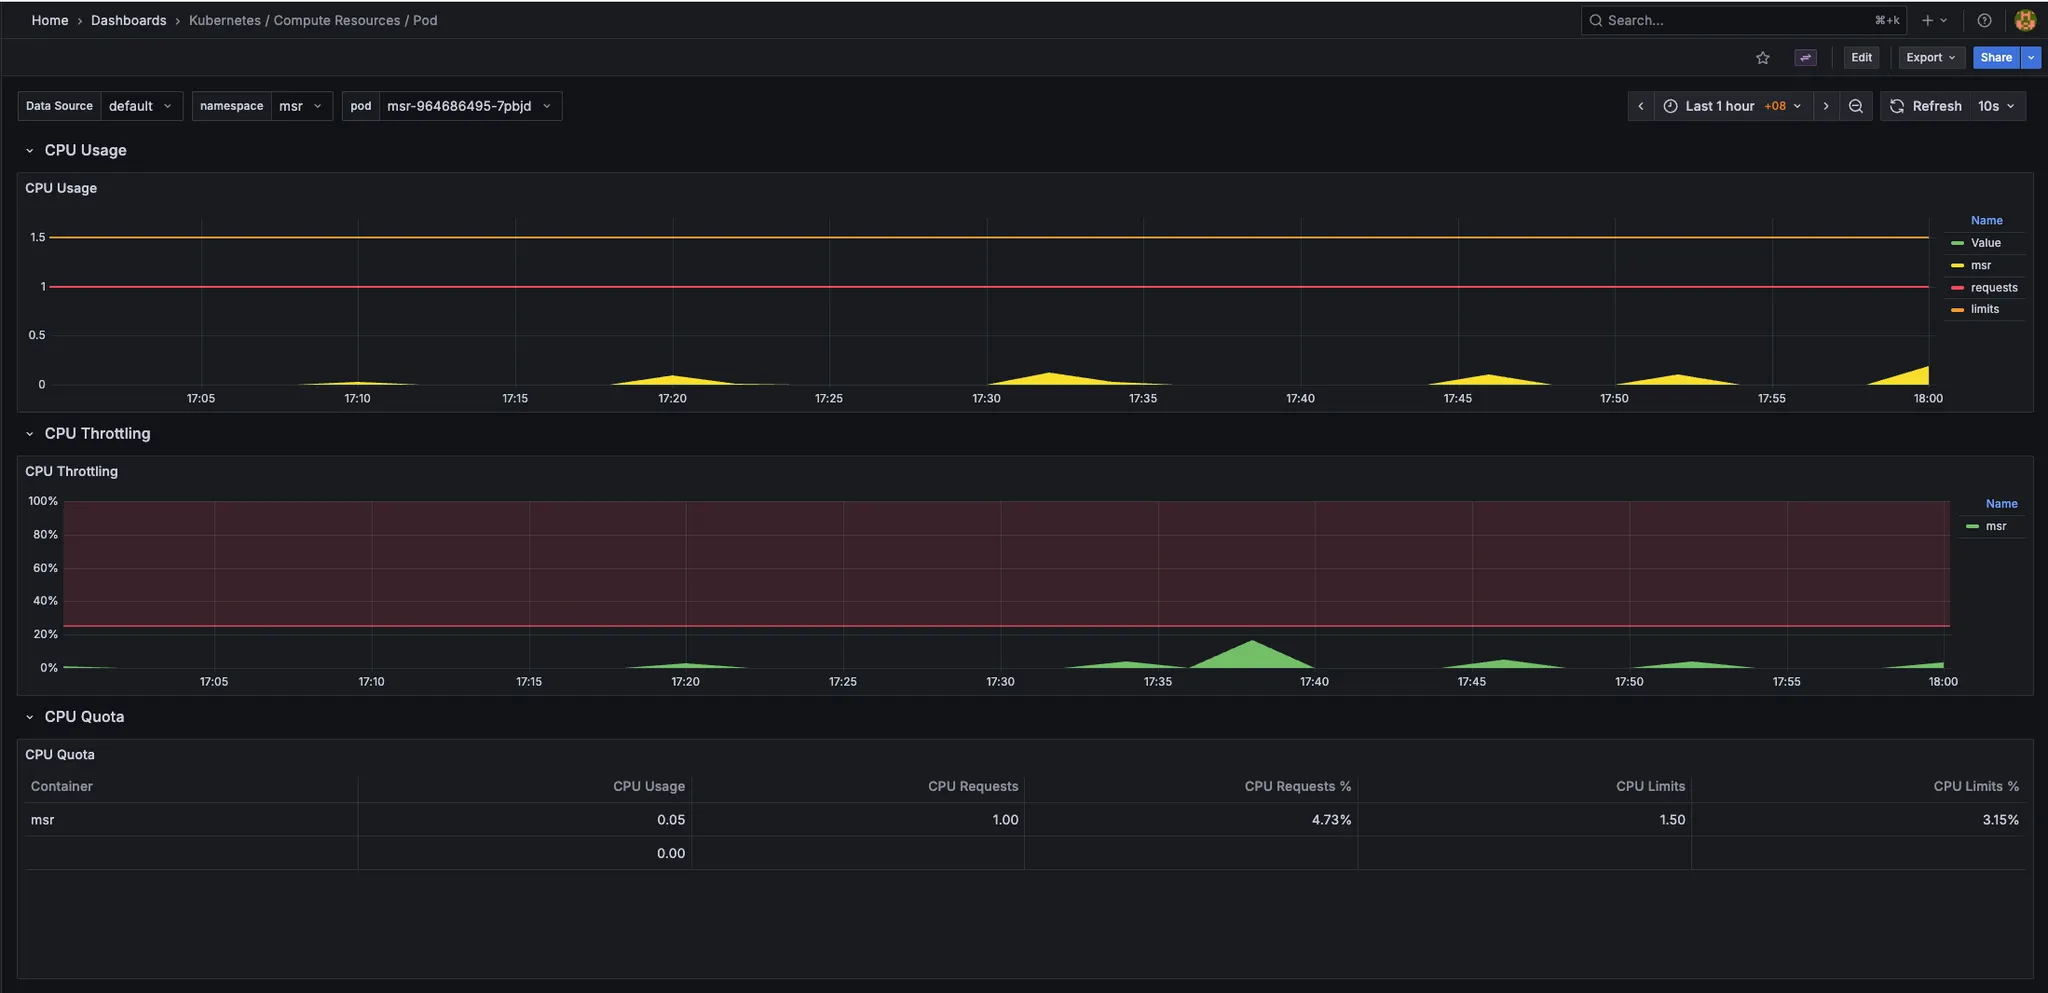
- Memory usage:
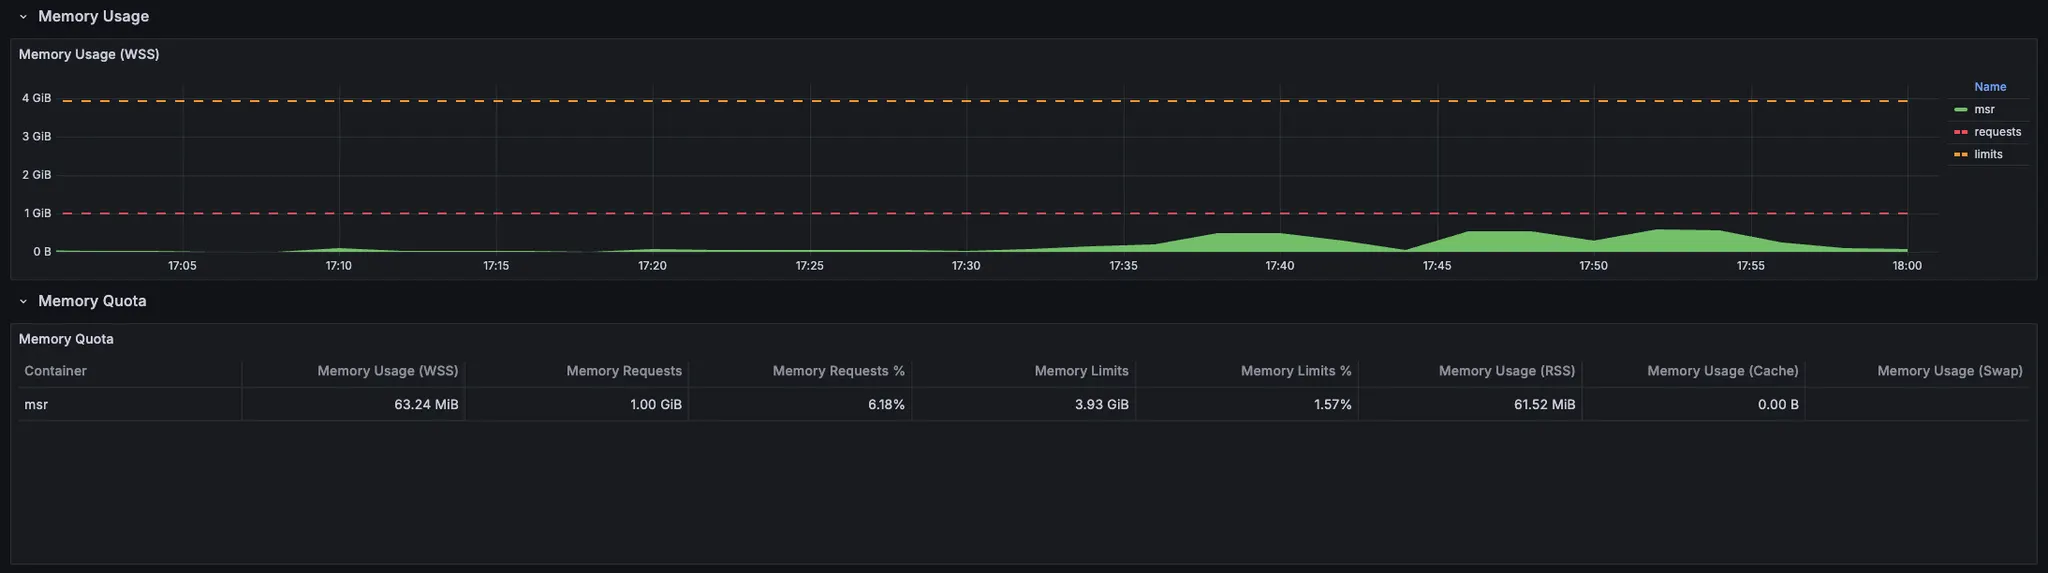
- CPU usage:
-
Timescaledb:
- During bump 3.6M records: MSR spike more than "1.5" CPU usage and "3GB" memory usage.
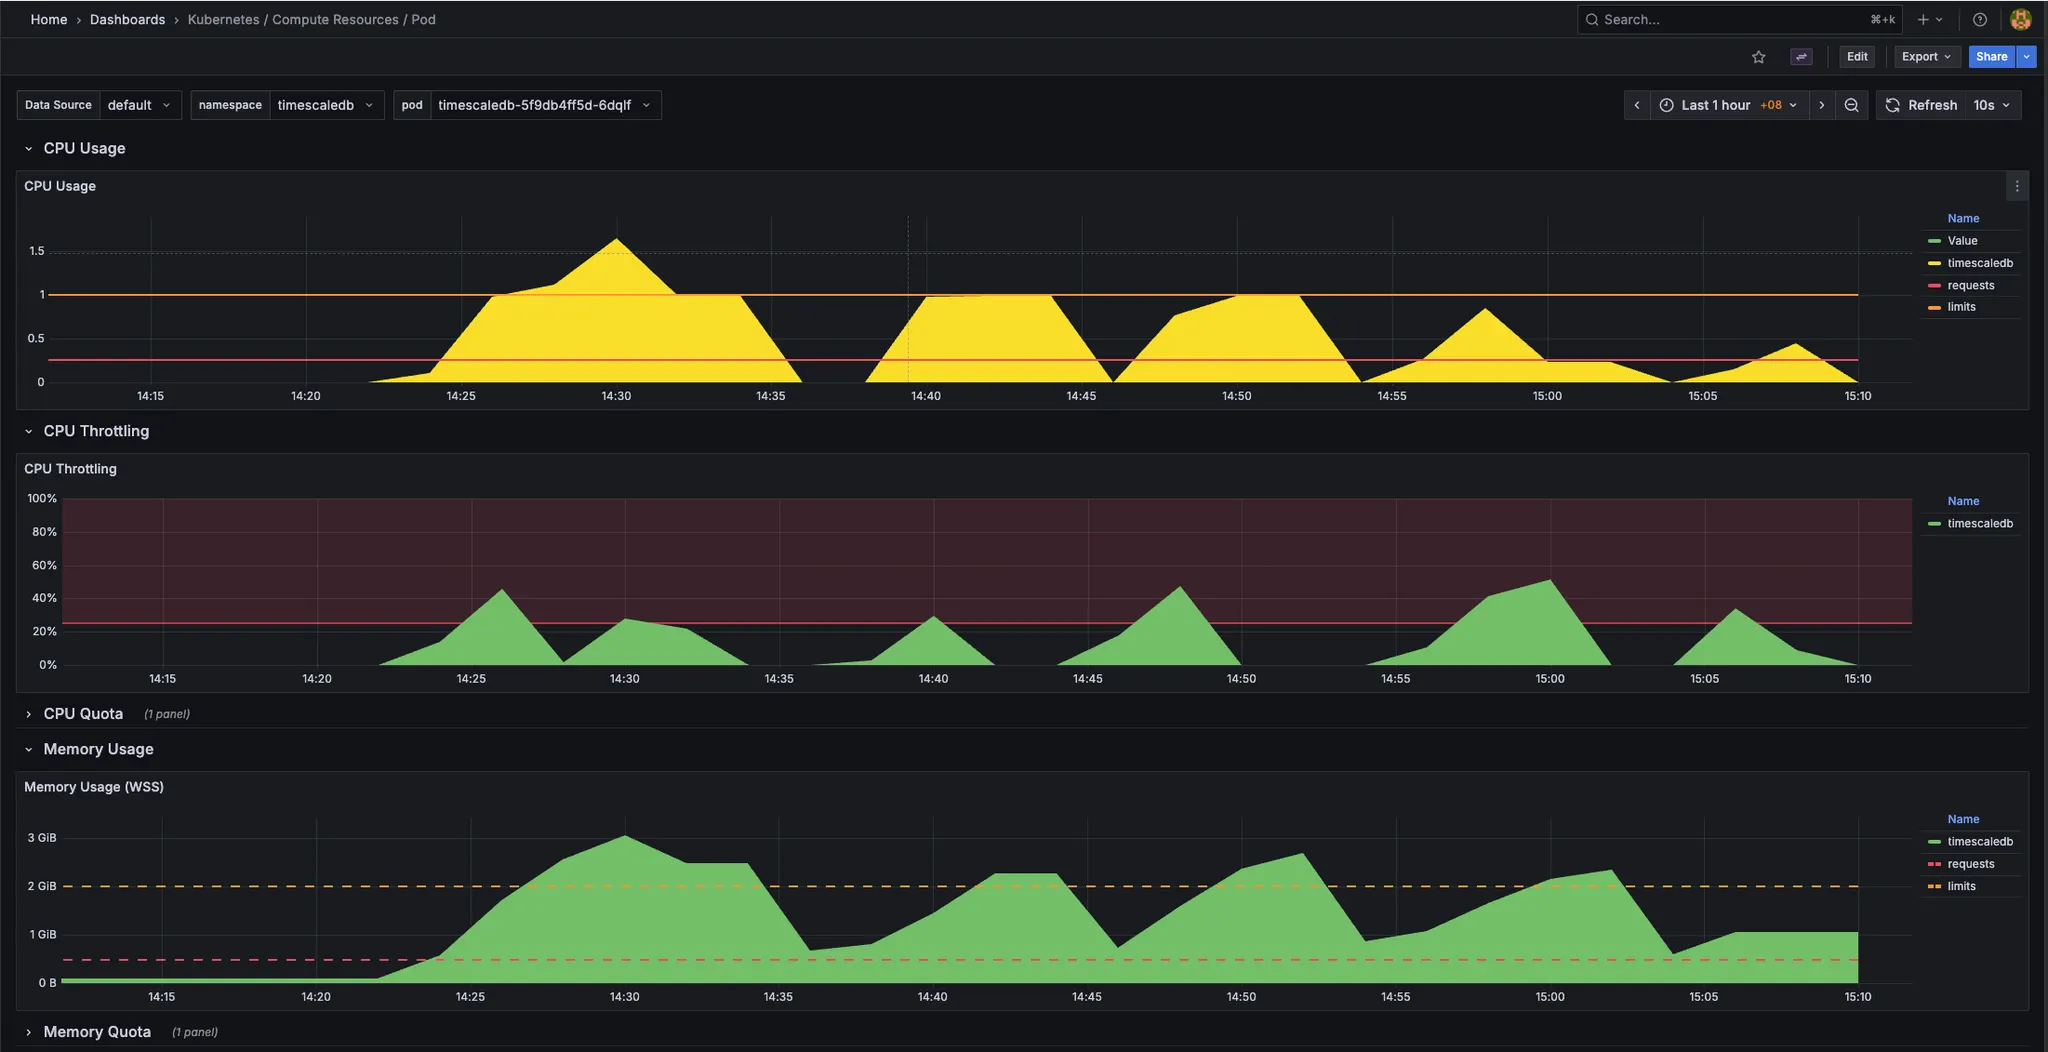
- During bump 3.6M records: MSR spike more than "1.5" CPU usage and "3GB" memory usage.
-
Resource required:
  - msr_app:
    - request:
      - cpu: 0.25
      - memory: 512MB
    - limit:
      - cpu: 0.5
      - memory: 1GB
  - timescaledb:
    - request:
      - cpu: 0.5
      - memory: 1GB
    - limit:
      - cpu: 1
      - memory: 2GB
- Resource recommendation:
  - msr_app:
    - request:
      - cpu: 0.5
      - memory: 1GB
    - limit:
      - cpu: 1
      - memory: 2GB
  - timescaledb:
    - request:
      - cpu: 1
      - memory: 2GB
    - limit:
      - cpu: 2
      - memory: 4GB
Conclusion
The MSR application API demonstrates stable performance under low concurrency (1-5 users) with 100% success rates and response times under 6 seconds. However, performance degrades significantly at higher concurrency levels:
- Optimal Range: 1-5 concurrent users
- Degraded Performance: 5-25 concurrent users (performance slows but remains stable)
- Critical Threshold: 50 concurrent users (unstable with 24% failure rate)
The system can handle high load but requires optimization to maintain acceptable response times. The large response payload size is a significant contributing factor to performance degradation under load.
Test Date: 2025-11-04 Application: MSR (Mission State Replay) Endpoint: https://msr.dev.agilopshub.com/replay/state Test Tool: Apache JMeter